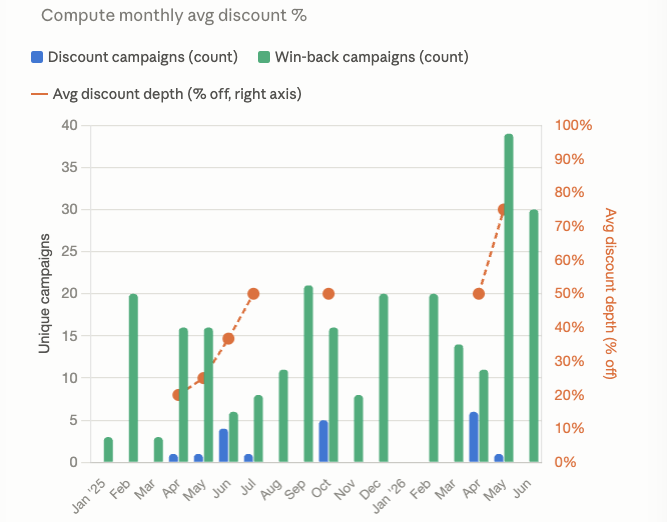
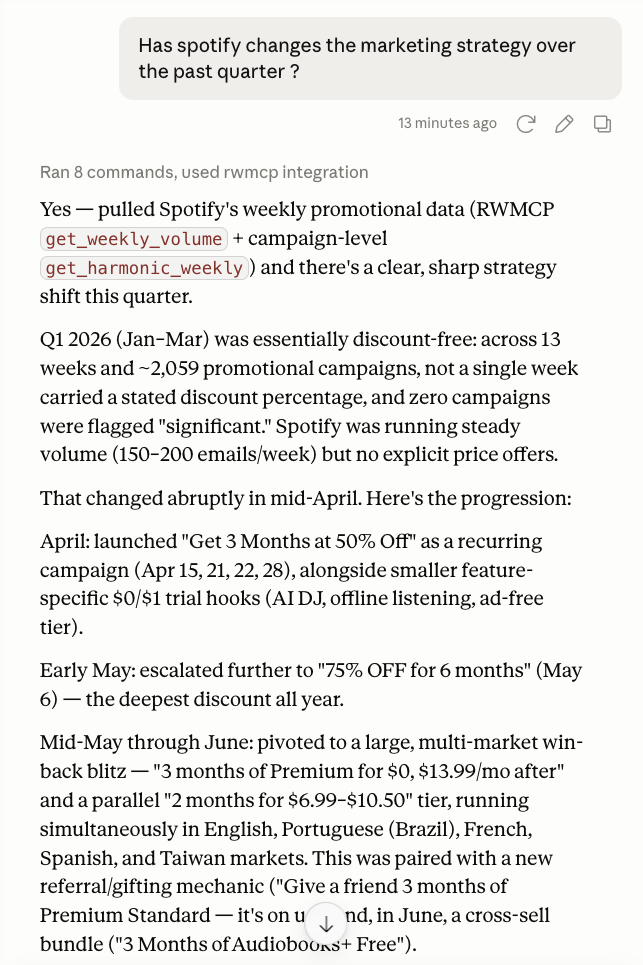
Our promotional ensemble revealed unusual discounts in the form of never seen before “75% off” language to attempt to push free users to premium.
However, leveraging Claude, it was able to unearth even more subtle changes. Its clear with years of price hikes for premium Spotify is now having to work harder convert.
RH: Promotional Email March Madness MARCH 31, 2026Restoration Hardware (RH) reported worse than expected sales, earnings and provided a tepid outlook.
Since our system uncovered and alerted investors to the inflection in late January, shares have collapsed 50%.
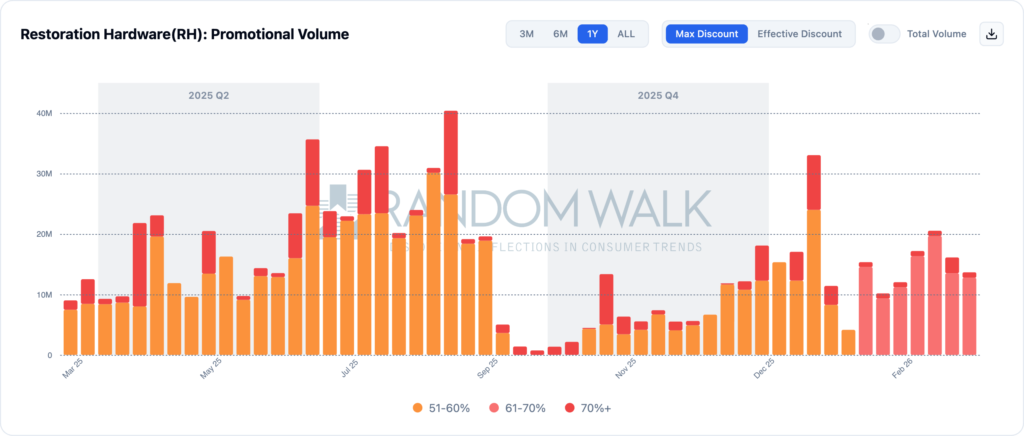
Most aligned with our process, RH guided Q1 revenues nearly $90 mm below consensus. Our promotional ensemble revealed a reversal in the controlled promotional volumes we tracked late last year. This Spring, we uncovered rapidly ramping campaign volumes and discounting language. Instead of 1-2 campaigns a week, in March we tracked near daily push offers.
Intensity also ramped, with our systems capturing escalating language with more 70% discounts, culminating in near daily offers the past 14 days.
Random Walk Promotional Dashboard As can be seen below, our ensemlbe triggered a code ‘red’ incicating steep 70% or higher discount language in the subject line.
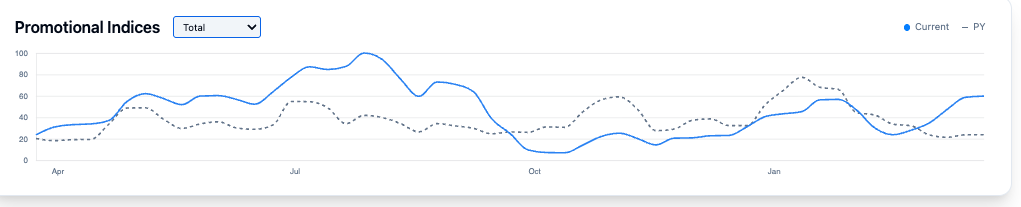
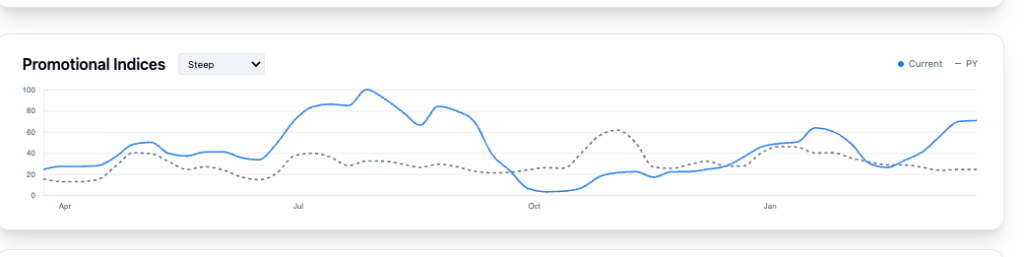
Reviewing Key Indices As can be seen below investors receiving our weekly index data were alerted to sharp deviations in two key indices: Total, and Steep,
Total Index after several quarters of stability ramped back above PY levels
Steep Index further validated a change in how management was viewing demand.
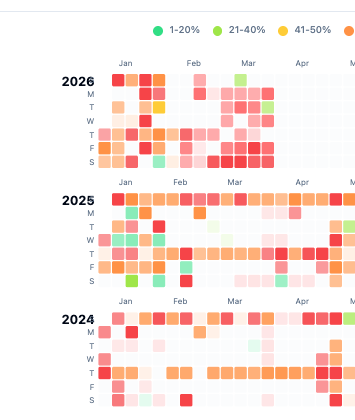
‘March Madness’ Promotional Calendar Our heat map detects the explosive growth in blasts and campaign frequency to leads with a disastrous end of March panic
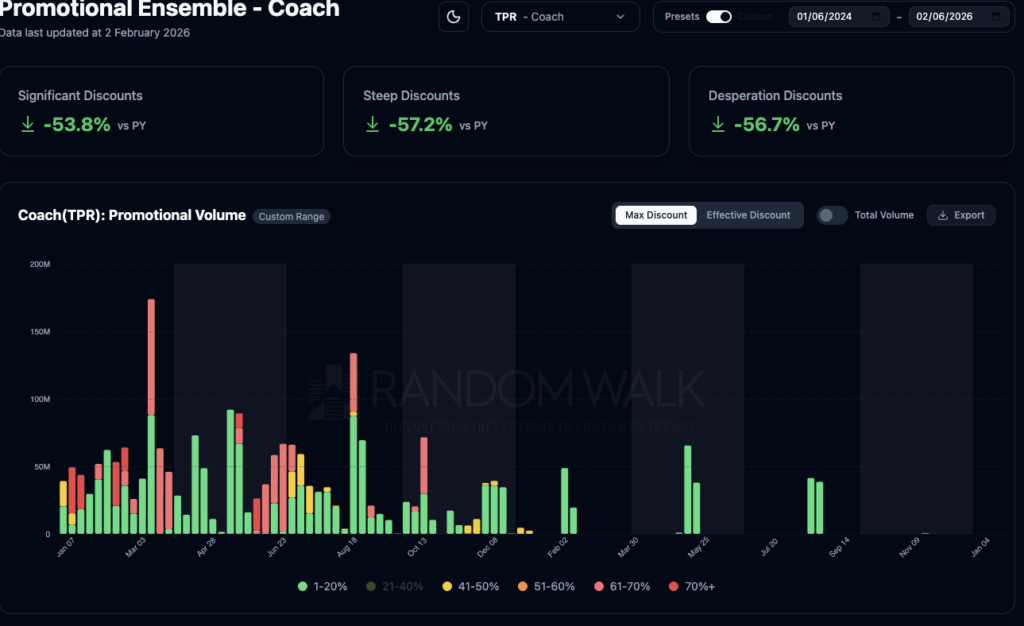
Another unbelievably strong quarter from Tapestry as consumer preferences further shift towards Coach. This has been an exciting one for Random Walk as continued sharp declines in email promotional campaigns have predicted this robust growth.
From the time our system tracked declining volumes of clearance emails and steep discounts shares are now up more than 110%!
Today’s Q2 results featuring 25% growth in Coach and strong gains in margins further validate our mission: when brands see robust organic growth, they quickly respond by reducing promotional email campaigns.
Our new dashboard shows every critical category from significant discounts to our clearance index in sharp decline. What an outlier!
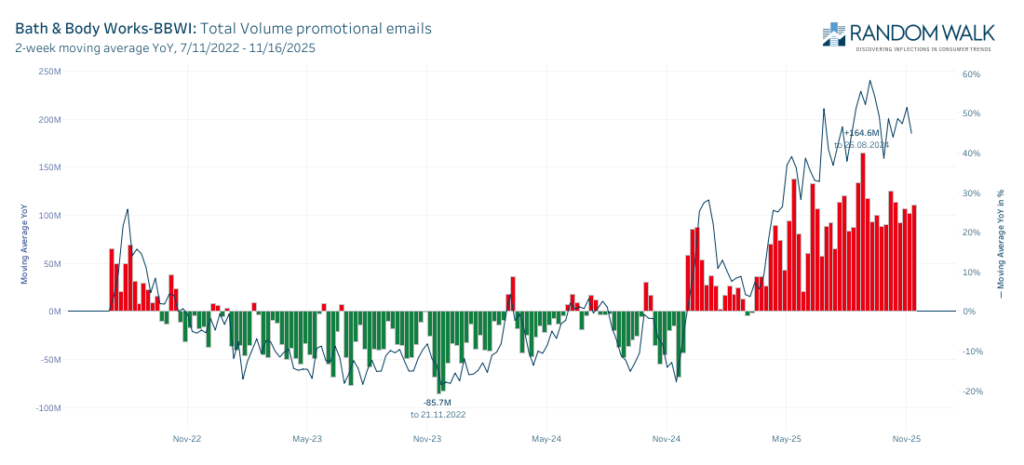
With rampant inflation continuing to chew into consumers purchasing power, we continue to see a shift away from demand for discretionary knick-knacks towards critical household staples including food and clothing. The diverging promotional growth patterns in BBWI and WMT make this trend apparent.
> BBWI forecast high single digit declines for the critical Q4 holiday quarter, noting a challenging start to holiday shopping beginning in Q3 … highly competitive environment”.
>. BBWI management’s final comment directly aligns the the email campaigns we tracked “…our customers are waiting for deeper discounts before making purchases.”
> Gross Profit Rate declined 220 basis points as management noted “increased promotional activity to clear inventory”.
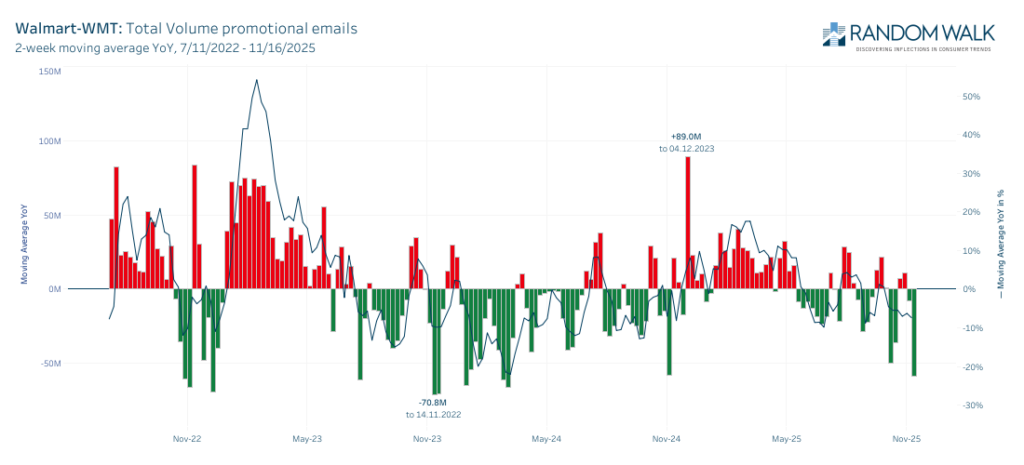
> Walmart (WMT) vs Bath & Body Works (BBWI) Not all retailers are exploding their promotional campaigns and email volumes. As seen below WMT total volumes actually declined into peak shopping season as consumer preferences shifted towards cost effective core needs and away from discretionary scented candles and bubbles..
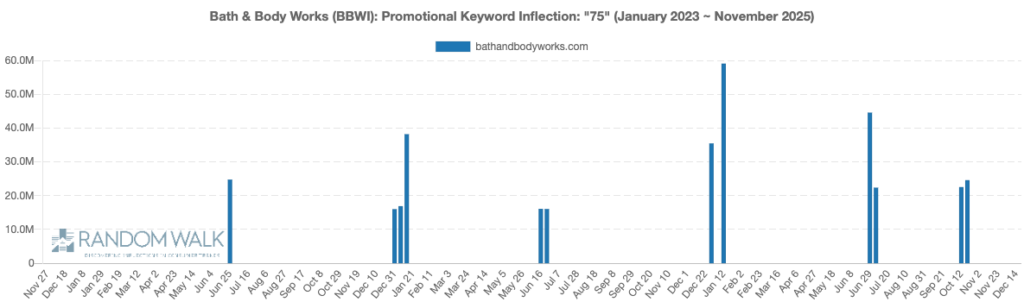
We captured explosive growth in 75% off campaigns from BBWI
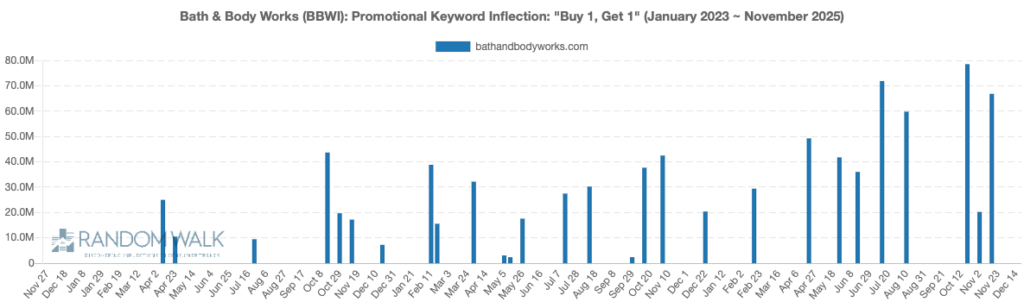
Additionally BBWI was forced to grow BOGO campaigns by nearly 300%
Our promotional ensemble was successful in detecting the inflection in Chipotle and Cava. As organic demand slowed both ‘bowl’ sellers began offering more and more freebies to their most loyal customers. Additionally, “new” product promotions and deals were send to a higher percentage of their lists. Instead of select targeted campaigns, massive blasts triggered our promotional ensemble.
Steve discussed the unusual activity in the restaurant sector
Are your research dollars allocated to detecting real inflections or have your overspent on predicting the present?
> Explosion in alternative data has led increased precision in predicting KPIs such as current quarter revenues and same store sales.
> Sudden share revaluations in brands such as DASH, MTCH, BROS, SIG, MODG and PLAY indicate significant opportunities remain in detecting organic inflections.
Above: Predicting an uncertain future, not overfitting the present. You’ll eat in: DASH, Your wont drive: TSLA,UBER, You wont go anywhere: DKNG, META, AMZN
Missing the Forest
The above advertisement from 1996 was prescient, but our promotional ensemble data can help investors better understand the tidal wave of changes that are occurring in real-time.
Institutional investors’ thirst for edge has led to overconsumption of complex ‘information’ that often misses the bigger shifts in preferences. Random Walk focuses on uncovering more actionable inflections based on changes in core demand for products and services through our Promotional Ensemble.
Stay Home and Swipe.
Perhaps mostly driven by 5G and engineered addiction of smart phones consumers are moving away from activities popular in the past. Dating, courtship, buying engagement rings and the products of Signet and marriage appear to be substituted by ordering Wingstop delivery on DoorDash and betting on sports with Draftkings.
Getting together and going out for in person entertainment at Topgolf or Dave & Busters is being replaced by swiping through Insta.
Random Walk Promotional Ensemble
When brands are struggling to generate demand the easiest and most cost effective band-aid is to blast out email discounts. This is where the Random Walk process provides unique edge. We have been capturing, categorizing and classifying millions of email promotions from leading brands for more than 7 years. If decaying inventory isn’t moving quick enough, without spending much on advertising, brands just push out escalating discounts to leads. Conversely, when organic demand is growing brands slow email campaigns.
DraftKings (DKNG): New deposit confirmations explode higher as consumers stay home and bet on sports.DoorDash (DASH): You’ll eat in. Doordash will bring food to you so you can stay inside. Our promotional ensemble indicates reduced incentives and email discounts as diners continue to grow rapidly.TopGolf (MODG): Interest in going out to TopGolf and shanking balls is waning as our promotional ensemble detects rapid growth in game play related gift cards and discounts.Dutch Brothers (BROS): Take it home no need for a cafe. Reduced promotional email volumes from Dutch Brothers
Random Walk has been serving investors for 14 years. After years of focusing on clicksteam, foot traffic data and other online measurement, in 2017 we shifted to focusing on creating the most quantitatively accurate promotional ensemble in the industry. As others used tractional data to incorrectly assess demand in department stores such as JC Penny, our process alerted investors that these sales were just a result of liquidation coupons.
Listen to learn more about our methodology is different than other big data providers below:
Our promotional ensemble indices are now available through Maiden Century. For many brands spikes in email promotional activity have meaningful relationships with gross profit and gross margin.
To provide the best experiences, we use technologies like cookies to store and/or access device information. Consenting to these technologies will allow us to process data such as browsing behavior or unique IDs on this site. Not consenting or withdrawing consent, may adversely affect certain features and functions.
Functional
Always active
The technical storage or access is strictly necessary for the legitimate purpose of enabling the use of a specific service explicitly requested by the subscriber or user, or for the sole purpose of carrying out the transmission of a communication over an electronic communications network.
Preferences
The technical storage or access is necessary for the legitimate purpose of storing preferences that are not requested by the subscriber or user.
Statistics
The technical storage or access that is used exclusively for statistical purposes.The technical storage or access that is used exclusively for anonymous statistical purposes. Without a subpoena, voluntary compliance on the part of your Internet Service Provider, or additional records from a third party, information stored or retrieved for this purpose alone cannot usually be used to identify you.
Marketing
The technical storage or access is required to create user profiles to send advertising, or to track the user on a website or across several websites for similar marketing purposes.