Acceleration in nearly every promotiponal email index conveys a change in strategy. Ulta appears increasingly reliant compared to past periods on ‘push’ discounts to beauty shoppers.
Random Walk Desperation Index, Steep Discount Index and Significant Discount Index are all either approaching or setting new highs this Spring.
New campaigns attempting to drive online engagement and conversion include:
“Open this email for FREE gifts and 50% off”
“FREE 4PC MAC Gift”
“FREE 17 PIECE SET”
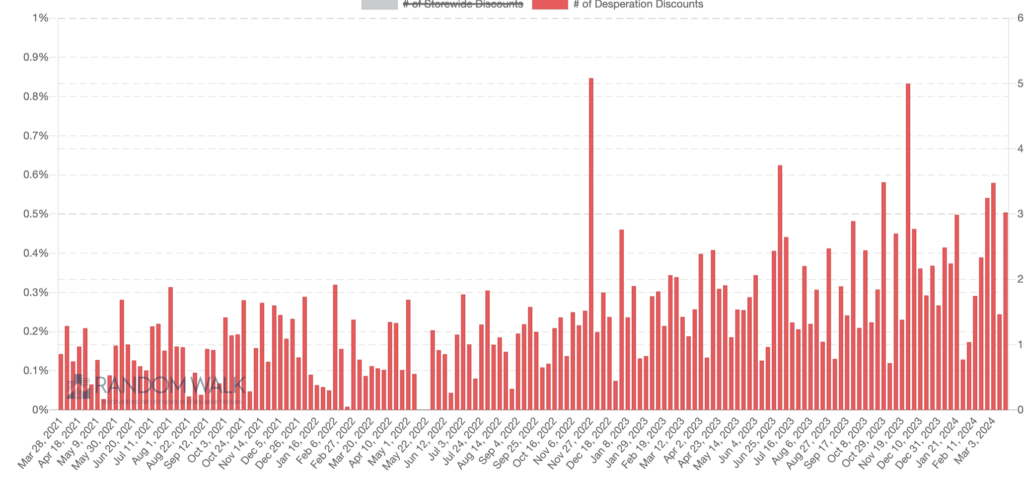
Desperation Index. Our new desperation index tracks growth in certain keywords within email campaigns such as “extended”, “free shipping”, “urgent” and “one more day” to name a few.
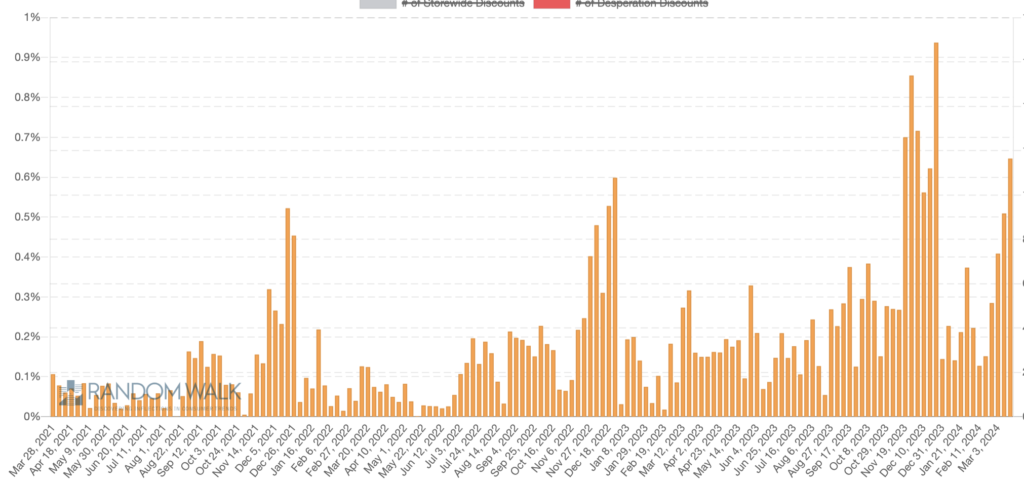
Steep Discount Index Our systems classify any coupon with an implied discount 40% off or steeper as steep. Recently Ulta has used much more 50% off language.
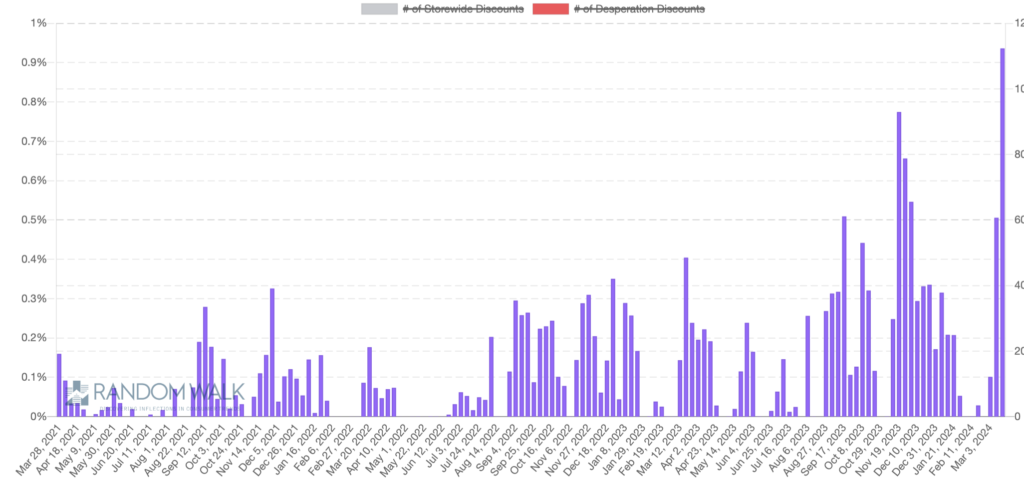
Significant Discount Volumes Our significant discount index tracking any coupon impacting the price has also shown acceleration beyond seasonal norms.
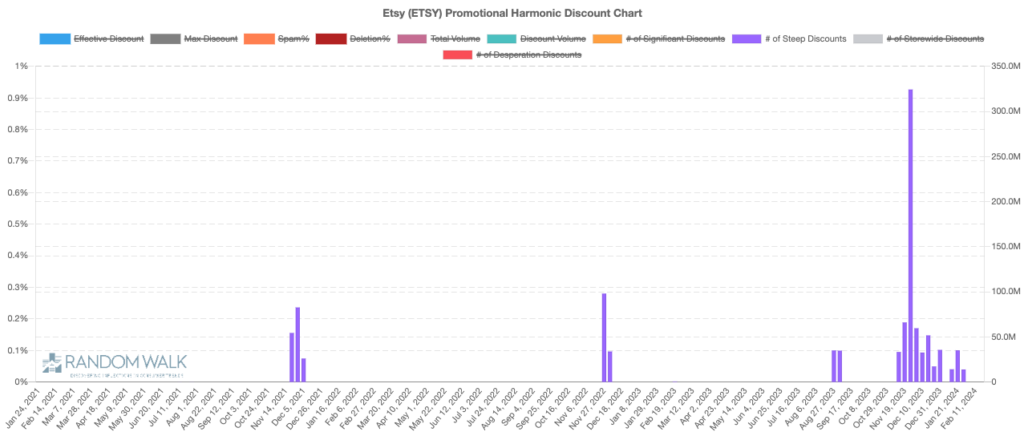
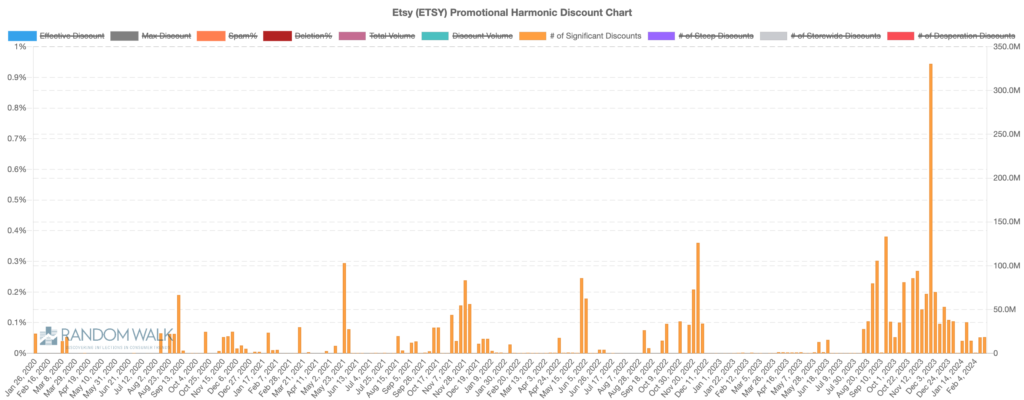
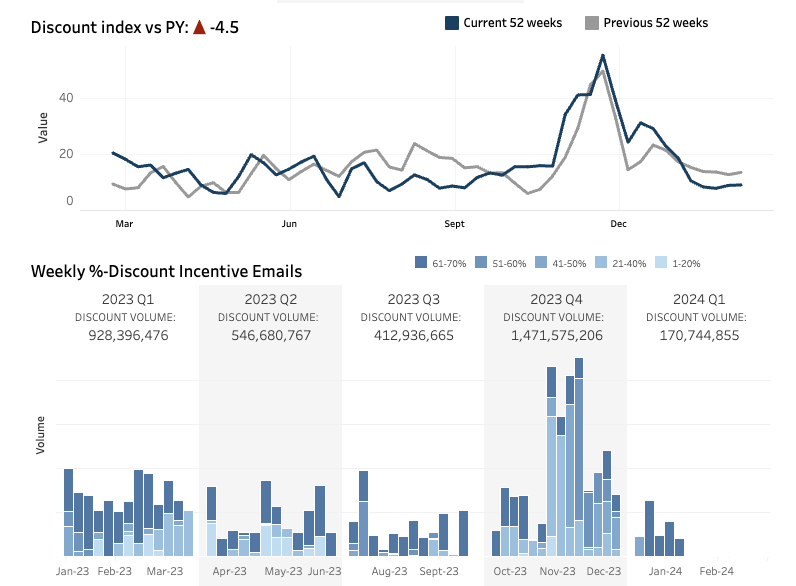
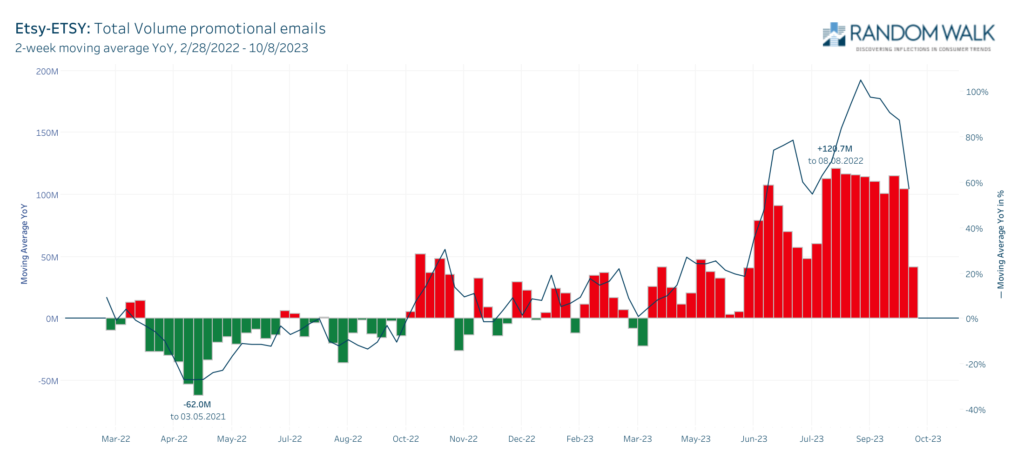
ETSY: Ensemble revealed new discount campaigns ahead of reduced outlook.
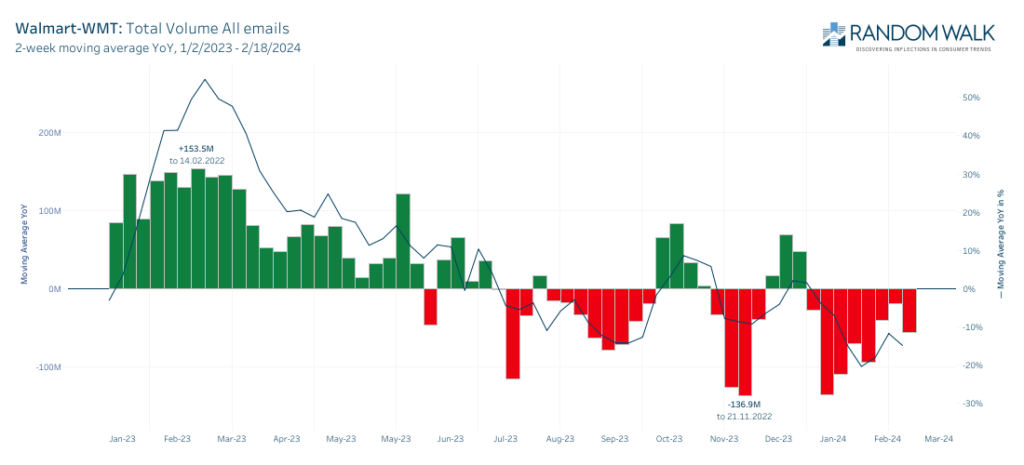
WMT: Ensemble tracked fewer email campaigns, and declining promotional discounts before improved inventory position and strong outlook.
While our competitors focus on precisely tracking revenues our promotional ensemble provides a more predictive gauge of organic demand. Our technology can uncover changes in how brands communicate with customers and leads.
With the holidays in the rear-view mirror, it appears demand receded, and management responded by ramping up the implied discount language in emails. We captured more campaigns using 40% off language for specific categories. These campaigns and language had never been used before.
Persistent declining sales for the mature marketplace provides clues that consumer preferences have shifted. Gone are the lockdown and stimulus-related tailwinds driving interest in at-home crafts, masks mini calendars, dog sweaters, cute cocktails mixology and other unessential at-home items.
As food costs have spiraled out of control consumers have shifted to the perceived value provided by Walmart.
Wall Street’s ‘silo’ style of coverage creates the opportunity as one analyst covers ‘internet’ with Etsy and entirely different team covers consumer staples and Walmart. Both are now technology companies. Our sector agnostic data driven approach makes it easy to compare the two. As seen in our composite, Walmart is clearly responding to improved inventory levels and robust demand by reducing their email campaigns and discounts
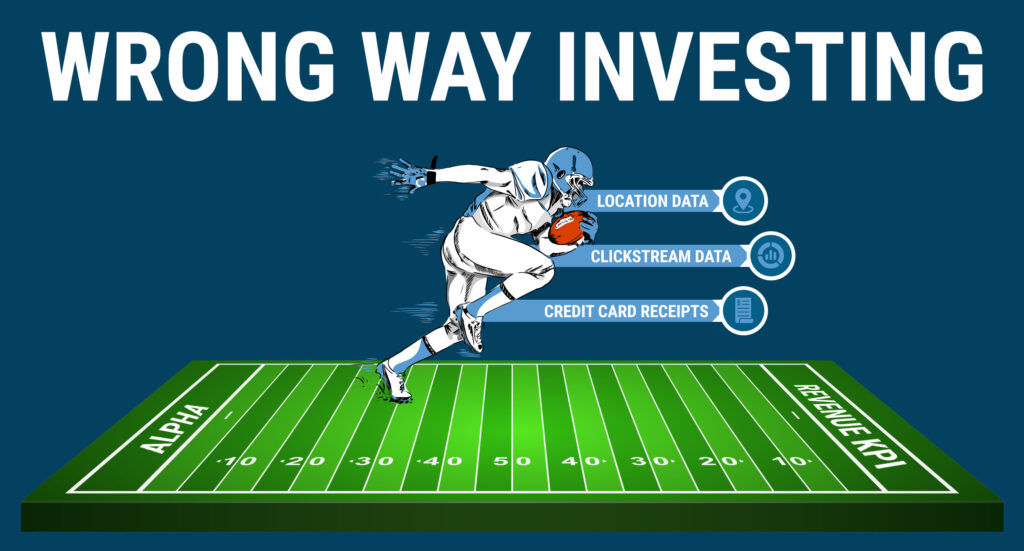
DoorDash (DASH), The Children’s Place (PLCE) , Etsy (ETSY), Restoration Hardware (RH)
Recently, third-party software platforms have emerged to track alt-data precision in KPIs such as subscribers, GMV, and revenues. The gamification of coincident indicator tracking has investors sprinting to the wrong end zone.
The revenue precision prediction game was highly effective during ZIRP, growth at any cost, 4 IPOs a day, 2 unicorns a week era. However, with a normalized cost of capital environment likely to persist, the ability to generate organic demand translating to earnings and future profits will TRUMP hitting current quarter revenue targets.
Commentary and guidance around future organic growth will generate alpha, not doing a touchdown dance in the revenue precision end zone. Being privy to excessively granular details such as that business slowed for 3.5 days due to rain isn’t likely to be rewarded in the markets if unrelated to longer-term organic growth.
he allure of data science mixed with hubris has created an eco-system with dozens of venture-backed alt data firms all purporting to be able to predict current quarter revenues with a tiny margin of error. Herding then compounds this with poor risk-reward. There is too much supply of data predicting the present with a black hole on the profitability and sustainability of such sales.
Experienced investors realize management has a wide range of tricks to meet their quotas such as pulling forward demand or spamming customers with coupons and promotions. With lead and customer lists in the millions, brands can quickly escalate discounting intensity until the product is moved.
The Random Walk Promotional Ensemble provides the most real-time and accurate view into this changing behavior. We uncover brands with the most egregious behavior changes behind-the-scenes email campaign blasts they are attempting to hide from institutional investors.
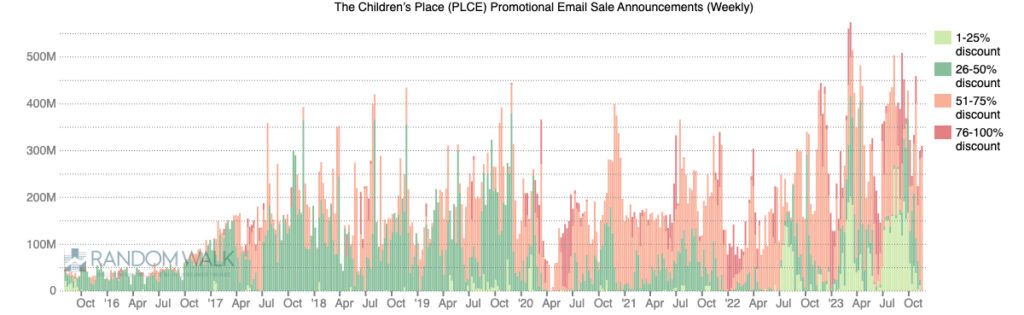
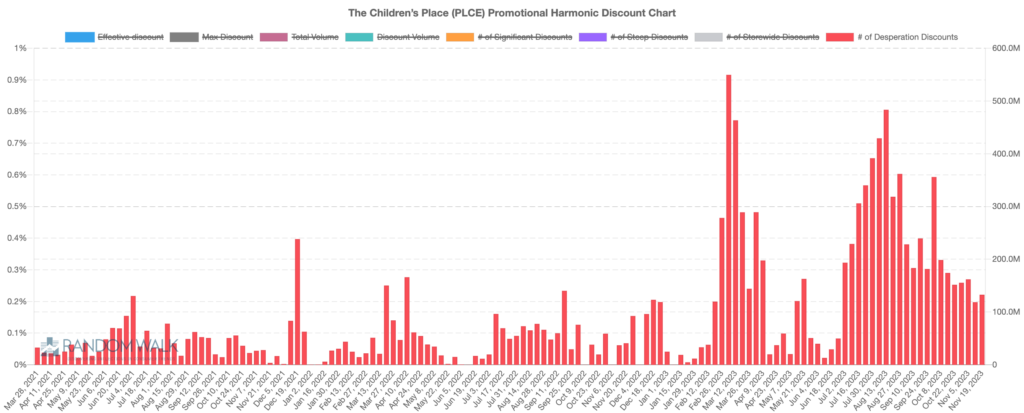
Recent results in Children’s Place (PLCE) reveal this disconnect. PLCE reported above consensus revenues of $480 mm vs. consensus of $465mm, yet guided the holiday quarter to a paltry $0.35 in earnings a dollar below expectations. Investors overweighing clickstream conversions and credit card data in their methodology scored touchdowns in the KPI end zone.
Meanwhile, our promotional ensemble alerted clients to unprecedented email volume, steep discounts, and never-seen-before language. This pattern is similar to other brands that have eventually evaporated from the public markets such as JCP and BBBY.
Explosive growth in promotions is the easy ‘tell’ that brands have lost their pricing power and ability to differentiate in a hyper-competitive marketplace in the shadow of Amazon.
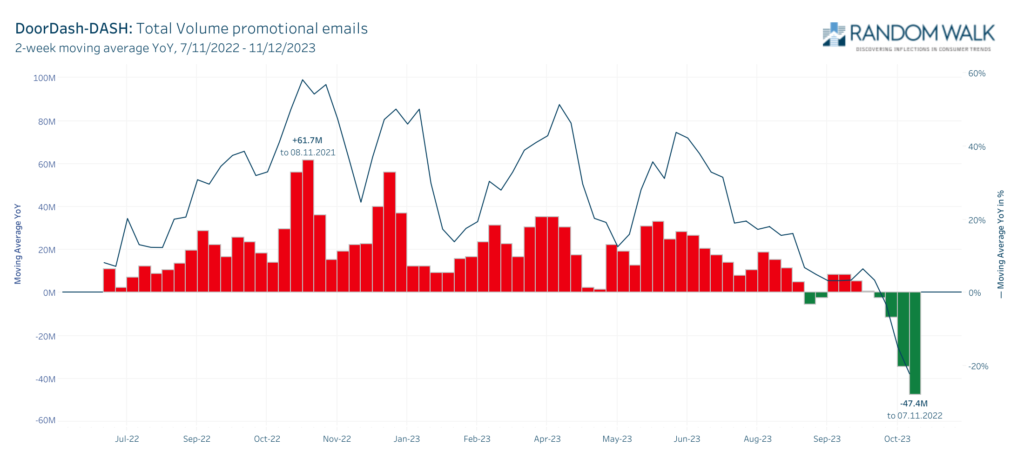
On the flip side, the Random Walk Promotional Ensemble revealed several businesses relying on fewer promotions and discounts. In DoorDash, we tracked a significant decline in the various promotions and discounts DASH has used in the past to draw new customers. We also captured fewer incentives for existing customers. This won’t translate to a precision GOV forecast, but reveals something much more valuable: Management is seeing stronger than prior period organic demand growth for its core product!
Soon after reducing the incentives, DoorDash reported nearly 300% growth in EBITDA and noted across-the-board acceleration.
Don’t get fooled into winning the academic decathlon of profitless predictions for revenues. Our promotional ensemble provides unique insight into how management reacts to changing demand. When demand sags, brands ramp up email-sending volume. With software to target various cohorts and segments “coupon clipping” will miss the first signs of slowing. Well before Etsy (ETSY) and Restoration Hardware (RH) reduced guidance they were dramatically increasing their email campaigns. The coupon clippers missed this because there were no coupons. Initially, in the face of slack demand, they increased the frequency of pinging their customers and leads with a variety of “check out our new furniture” type campaigns. Our total email volume index alerted investors to these changes, warning them.
Random Walk email intelligence through our promotional ensemble delivers the most quantitative and predictive tracking of implied discounts and promotional cadence available. When brands are struggling to generate organic demand they ramp up sending volume to their leads and customers. We capture these potential inflections in near real-time and alert our investor partners ahead of the street.
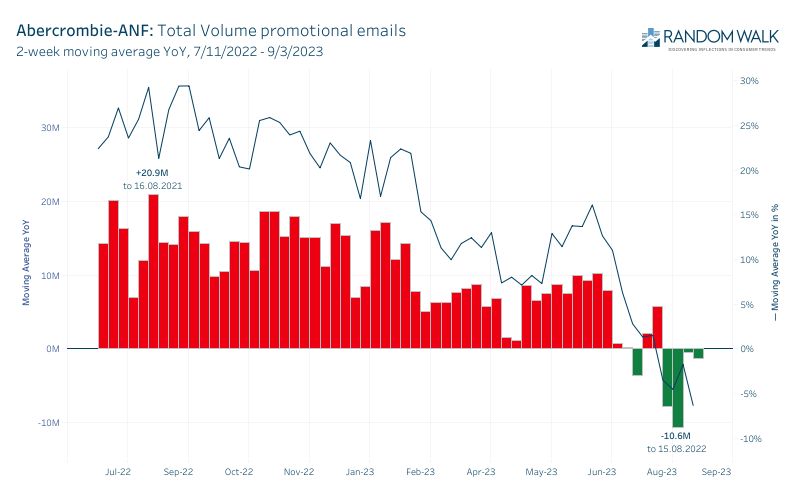
Abercrombie & Fitch (ANF)
TOTAL PROMOTIONAL VOLUME + 9% GROSS MARGIN +460bps
TOTAL PROMOTIONAL VOLUME +650% GROSS MARGIN: -550bps
Petco (WOOF)
STEEP DISCOUNT VOLUME +780% GROSS MARGIN: -140bps
Ulta Beauty (ULTA)
STEEP DISCOUNT VOLUME +107% GROSS MARGIN -110bps
Walmart Inc. (WMT)
STEEP DISCOUNT VOLUME-37% GROSS MARGIN 40bps
ANF: Sharply declining total promotions translate to gross margin gains of 460bpsOLPX: Exploding total promotional volumes translate to forecast gross margin delcines of 600bps
Random Walk New Keyword Tracker Launched. Our new technology helps investors instantly detect changes in the promotional intensity brands are using to communicate with leads. Detect inflections in core demand through tracking of desperation keywords in emails such as “extra”, “extended”, and “one more day”.
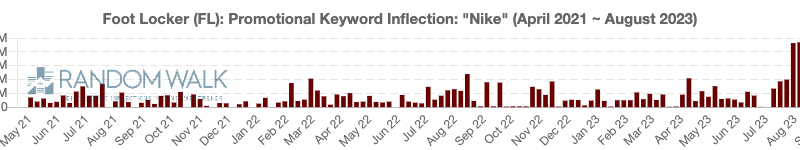
Keyword tracker uncovered the largest ever spike in “Nike” related keywords from key wholesale partner email correspondance over the past two weeks.
PREVIEW: Promotional Outlier Focus: Nike Partners Sending Record Volume of Discount Campaigns ASO, DKS, FL, M, NKE, SCVL
Last quarter, Nike reported slowing revenue growth as consolidated revenue increased year-over-year by 5%, down from 14% year-over-year growth in the prior quarter. While total promotional activity direct from Nike is stable, we are capturing record breaking volumes of Nike coupons from wholesale partners implying lagging organic demand. We also anticipate a weak quarter for Foot Locker, which purchased 65% of its athletic merchandise from Nike during the most recent fiscal year.
NIKE PARTNER PROMOTIONAL HIGHLIGHTS Foot Locker (FL) sent record volumes of “Nike” focused promotions in July. We have tracked a 67% year-over-year increase in email volumes containing “Nike” for the May-July period
.Academy Sports & Outdoors (ASO) sent greater volumes of “Nike” focused promotions this Summer. We tracked a 49% year-over-year increase in email volumes containing “Nike” for the May-July period.
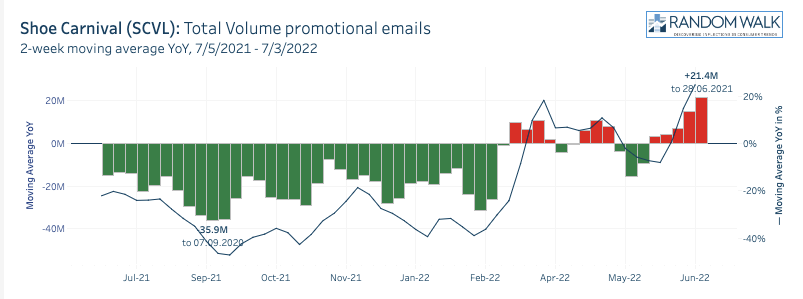
Shoe Carnival (SCVL) Shoe Carnival “Nike” focused promotion volume increased by 2,783% on a year-over-year basis for the May-July period.
Macy’s (M) We captured a rare “Special 20-25% off from Nike”.
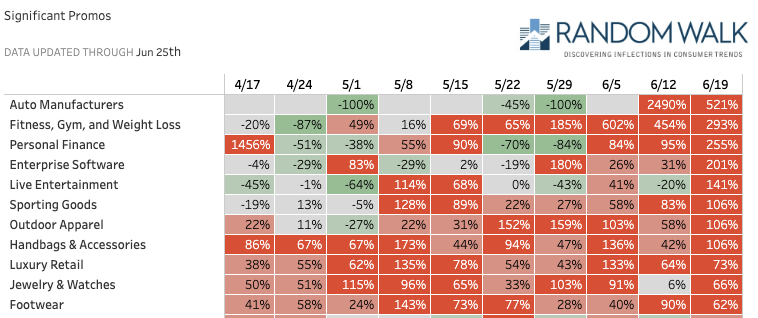
We recently launched a new product that examines trends of promotional activity within subsectors.
Highlights:
Footwear promotional volume continues to accelerate higher. 9 of the 13 tickers in our footwear index exhibited a “worsening” promotional trend last week with 12 of 14 worsening on a monthly basis.
Luxury Retail demand appears weak as significant promotional volume has worsened on a YoY rate of change basis at several major companies in our subsector index.
The Sporting Goods subsector has emerged as another addition to the worsening list. All 8 companies in this index have sent out substantially higher promotional volume in the most recent week compared to the prior year.
Outdoor Apparel promotions continue to stand out as significant promotion volume YoY growth for this subsector exceeded 100% in three consecutive weeks recently.
Demand doesn’t appear to be returning at home improvement retailers. Promotional volume is substantially higher at all 5 companies in our index compared to the prior year.
APRIL 20, 2023 Random Walk Email intelligence suggests management is responding to fading organic demand in home furnishings and home improvement with more aggressive pushed offers to their leads lists this spring
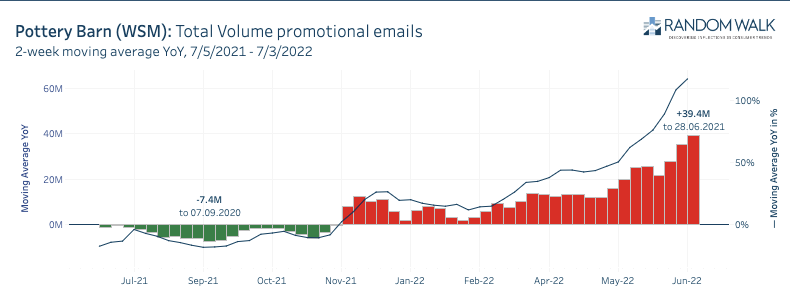
Home and home furnishing related names have been more aggressive in sending promotions to leads this April compared to last, with Wayfair (W) and Pottery Barn(WSM) as standouts on our slowing list. Each had more faster ramps year-over-year promotion growth in significant discounts.
Home improvement retailers Home Depot (HD) and Lowe’s (LOW) are dealing with declining demand in part by sending new and more frequent email promotions to leads. We also recently captured new spring holiday language unseen in prior years.
In terms of fastest growers of total email volumes Floor & Decor (FND) stands out. Total promotional volume is a good way to measure concerns from brands that do not discount such as Restoration Hardware(RH). As can be seen above, RH is sending more communications to leads, despite no significant discounts outside of the outlet.
Our updated promotional ensembles provide the most robust, quantitative and rigorous views of how brands are communicating with leads.
Our promotional ensemble identified the biggest outliers of the period from several weeks before Black Friday through Cyber Week for our investor partners.
Standouts with previously unseen promotions, largest risers in discount campaigns, or those with robust organic demand that were able to reduce email volumes include:
Our email intelligence systems have been capturing tracking and classifying emails from leading brand for nearly 7 years providing the most robust, quantitative insight into email promotional activity. i
The quickest and cheapest method for management to respond to demand inflections is to adjust its cadence and intensity of email discounts.
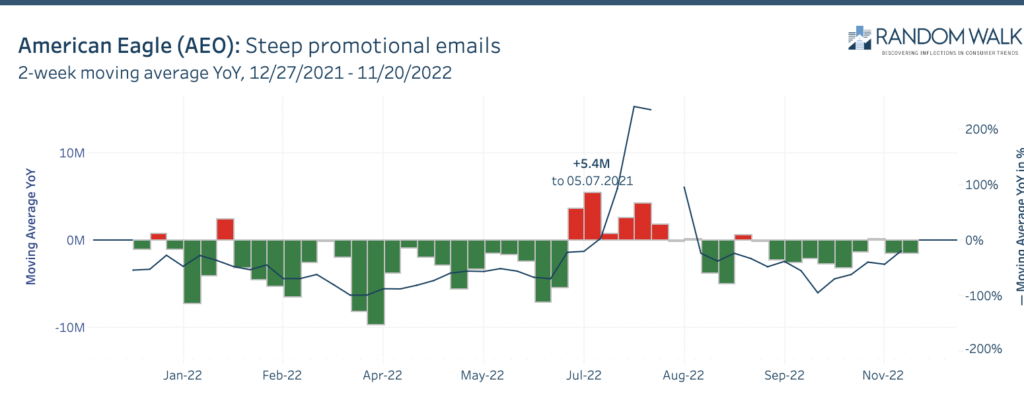
AMERICAN EAGLE OUTFITTERS (AEO) Both total promotional email volume and significant discounts nearly 30% lower than a year ago.
GAMESTOP (GME) Meteoric rise in BF related promotional activity with “$50 off x box” and “up to 60% off video games”.
HELLO FRESH (HLFF) Total promotional email volumes up nearly 300% driven by “$180 off Thanksgiving” and “get up to 70% off” discounts.
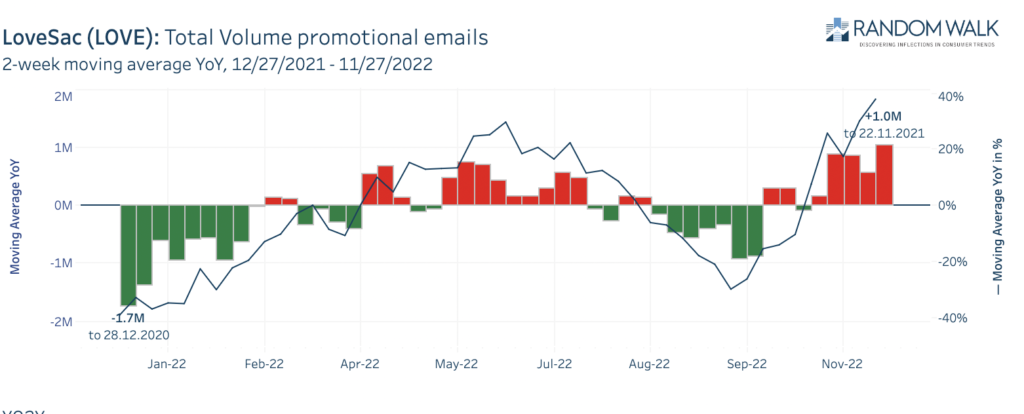
LOVESAC (LOVE) Steeper than year ago and higher volume significant discounts driven by “35% off Bundles”.
NIKE (NKE) Sequential and YoY declines in steep and significant discounts
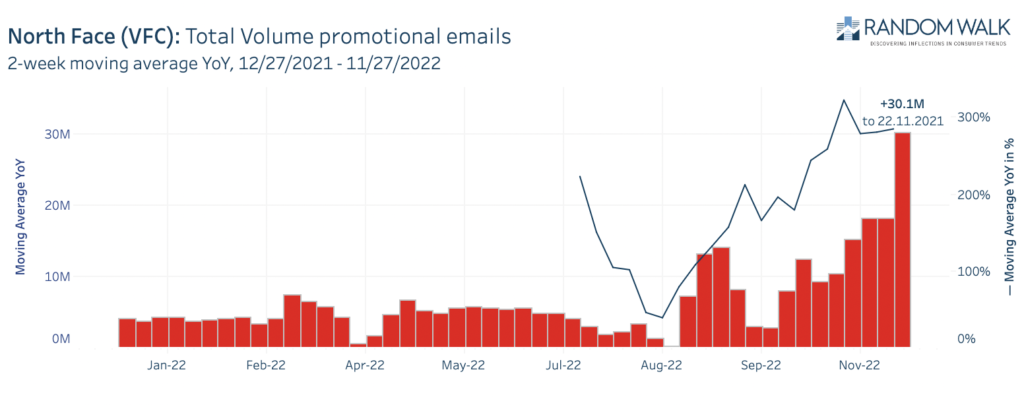
VF CORP (VFC) Both North Face and Vans saw sharp rises in all categories of email promotions. Total inbox volumes, significant discounts, steep discounts and storewide promotions all rose to record highs.
contact us for to see the entire Holiday Promotional Outlier List
Random Walk Email Intelligence has never identified more unusual promotional activity than over the past 30 days. In June alone our systems have captured nearly 100 never seen before campaigns as consumer preferences shift.
HOME FURNISHING PROMOTIONS ACCELERATE TO NEW HIGHS
BIG, LOVE, W, WSM
In home furnishings our data indicates COVID pulled forward, not just several quarters but year’s worth of demand. Now, with the backyard, garage space and wallets maxed out, consumers are shifting away from creating the perfect Instagram worthy at-home backyard oasis.
Random Walk Email Intelligence indicates record growth the discount campaigns in Q2 from Pottery Barn.
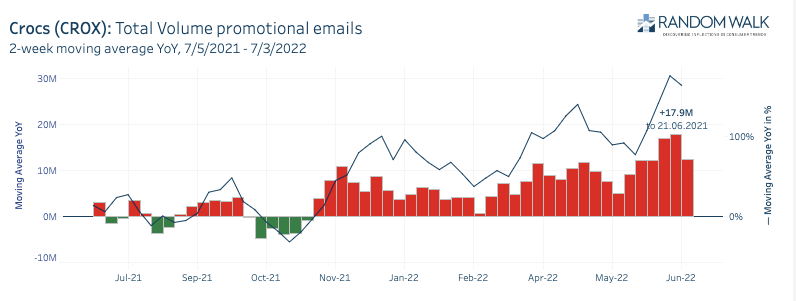
DEMAND FOR CASUAL ‘AT HOME’ FOOTWEAR FADING?
CROX, FL, SCVL
During COVID, Americans gobbled up footwear for the outdoors or comfort around the house casual footwear retailers benefitted and throttled back promotions. However, this summer with consumers more spartan due to gas prices and $20 hamburgers they don’t appear to need so many sandals.
Crocs and Crocs retailers such as Foot Locker and Shoe Carnival have been blasting an all-time high volume of Croc’s specific discounts.
GET OUTDOORS ON THE ROAD MEETS $6 GAS
CWH, WGO, YETI
Without COVID checks, a free pass from work, and with $6 gas it appears road trip RV, van and mega SUV trips could be stalling. Our email intelligence has tracked growth in promotional volumes for outdoor camping accessory related businesses such as Camping World, Winnebago, and Yeti.
Into summer camping season Camping World has blasted out an all-time high volume of significant and steep discounts.
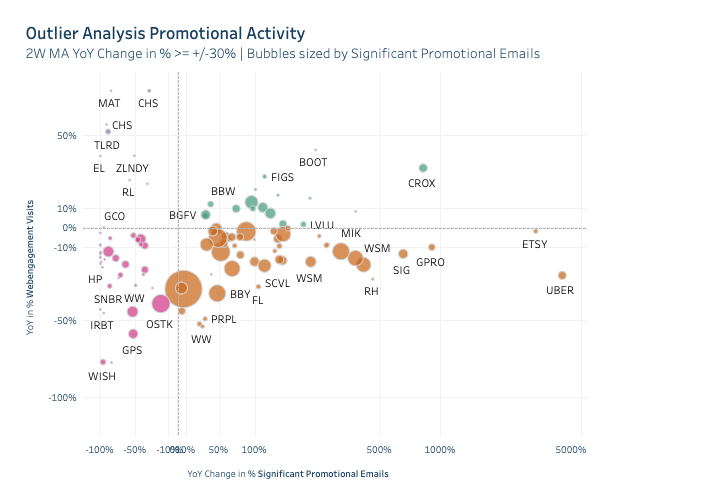
Our data visualizations allow quick identification of outliers within a specific sector. Find out which brands are losing organic demand and responding with increased “push” discounting campaigns to their leads
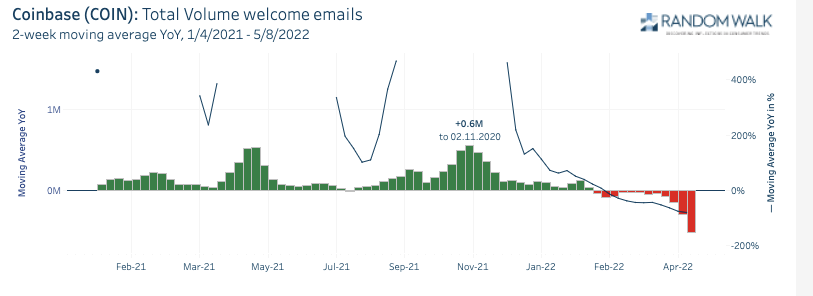
> Email Intelligence successfully detected the collapse of one of the biggest FOMO driven manias in US history: “crypto trading”.
> Random Walk ensemble alerted investor partners to sharp deceleration in orders, new account “welcome” confirmations, as well as a higher deletion rate for new product offerings.
> Wall Street bankers and analysts, motivated to sell the management “narrative”, extrapolate unsustainable growth rates into the future, but RW data can help uncover inflections
In 2020 and into 2021 our data indicated strong, but likely transient growth in new “Welcome to Coinbase” email confirmations. This unsustainable growth was driven by a ‘Black Swan’ mosaic of factors: bored locked down Americans, unprecedented Uncle Sam stimulus checks, and social media FOMO pictures of teens in pajamas getting rich trading Crypto Kitties.
After lockdowns and free money ended in late 2021 our ensemble uncovered slowing in new customer confirmation emails, and we added COIN to our slowing list.
‘GENIUS’ SUPER BOWL QR AD GENERATES CLICKS NOT CUSTOMERS
Above: Super Bowl Ad fails to generate customers, but drove worthless clicks due to its nebulous nature
Several additional data driven trends revealed themselves earlier this year. The inability for a $14 million Super Bowl ad to attract new customers was apparent as our data detected no spike in new accounts. While the media focused on worthless “clicks” our data showed a lack of actual new customers. Management hubris led to equivocating marketing a crypto-trading platform with proven consumers products such as alcohol/beer, quick service restaurants, auto, apparel etc.
In March, our email intelligence indicated very high delete rates for new products marketed with email promotions such as Coinbase One, and Coinbase NFTs. With gas at $6 a gallon and $25 hamburgers and rising rates, consumers had lost interest, as they prioritized getting to work and feeding their families over possessing digital unicorn.
BITCOIN SPIKES, TRADING VOLUMES DON’T
The lack of interest in trading “cryptos” despite a spike in bitcoin after Putin invaded Ukraine showed in our data and confirmed the slowing trend.
AS BROADER EQUITY MARKETS CORRECT, CUSTOMER GROWTH ENDS
Once the high growth equity tech bubble began to collapse and consumers saw their 529 plans, 401ks, and brokerage accounts decline, they quickly shifted their preferences away from crypto trading.
To provide the best experiences, we use technologies like cookies to store and/or access device information. Consenting to these technologies will allow us to process data such as browsing behavior or unique IDs on this site. Not consenting or withdrawing consent, may adversely affect certain features and functions.
Functional
Always active
The technical storage or access is strictly necessary for the legitimate purpose of enabling the use of a specific service explicitly requested by the subscriber or user, or for the sole purpose of carrying out the transmission of a communication over an electronic communications network.
Preferences
The technical storage or access is necessary for the legitimate purpose of storing preferences that are not requested by the subscriber or user.
Statistics
The technical storage or access that is used exclusively for statistical purposes.The technical storage or access that is used exclusively for anonymous statistical purposes. Without a subpoena, voluntary compliance on the part of your Internet Service Provider, or additional records from a third party, information stored or retrieved for this purpose alone cannot usually be used to identify you.
Marketing
The technical storage or access is required to create user profiles to send advertising, or to track the user on a website or across several websites for similar marketing purposes.