
Web Analytics Made Easy - Statcounter

Category Archives: Blog

ULTA: Inflection in Email Marketing

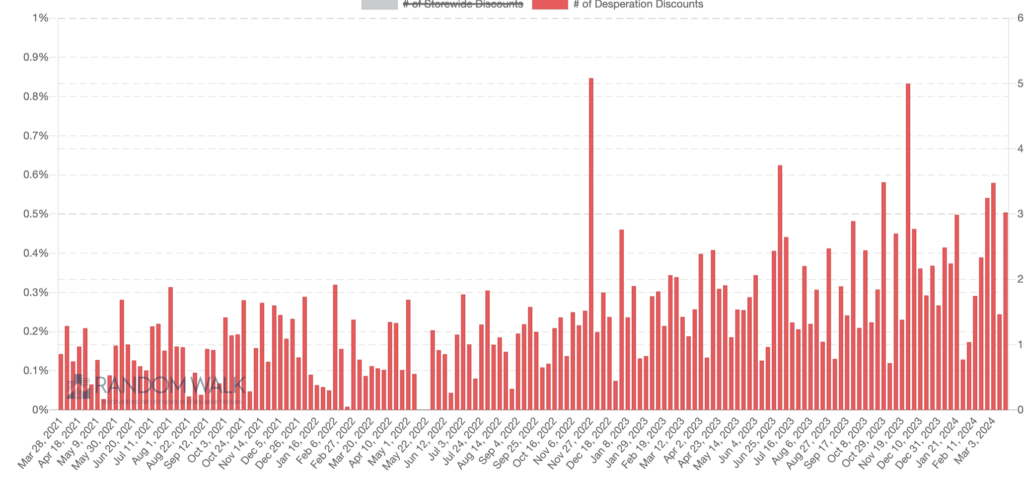
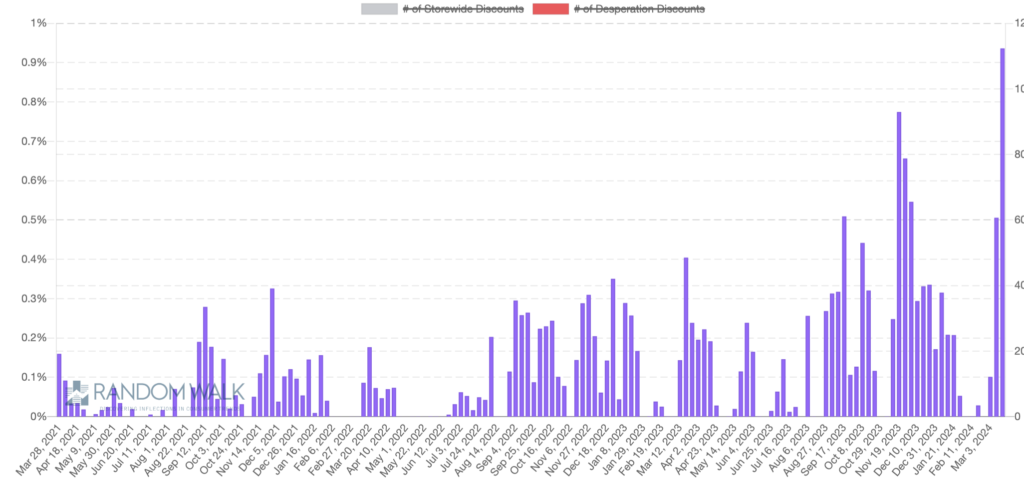
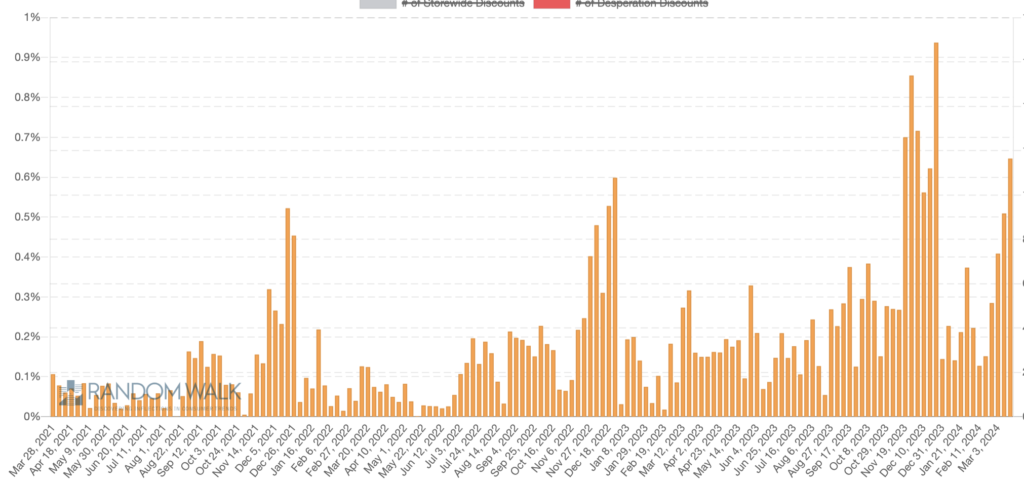
Acceleration in nearly every promotiponal email index conveys a change in strategy. Ulta appears increasingly reliant compared to past periods on ‘push’ discounts to beauty shoppers.

Random Walk Desperation Index, Steep Discount Index and Significant Discount Index are all either approaching or setting new highs this Spring.

New campaigns attempting to drive online engagement and conversion include:

“Open this email for FREE gifts and 50% off”

“FREE 4PC MAC Gift”

“FREE 17 PIECE SET”

Desperation Index. Our new desperation index tracks growth in certain keywords within email campaigns such as “extended”, “free shipping”, “urgent” and “one more day” to name a few.
Steep Discount Index   Our systems classify any coupon with an implied discount 40% off or steeper as steep.  Recently Ulta has used much more 50% off language. 
Significant Discount Volumes Our significant discount index tracking any coupon impacting the price has also shown acceleration beyond seasonal norms.
ABNB: Bookings Appeared to Decelerate in September

All three of our datasets tracking ABNB confirmations were weak in September. The “reservation confirmed” dataset turned negative Y/Y during the last week in September after displaying strong Y/Y gains earlier in the month. Our tracking of “receipts” slowed as the month progressed, however the Y/Y trend remained positive. The “Welcome” dataset also displayed a consistent negative Y/Y trend.

Based on these confirmation datasets and slowing web traffic, we believe it’s likely that ABNB’s business slowed in September.

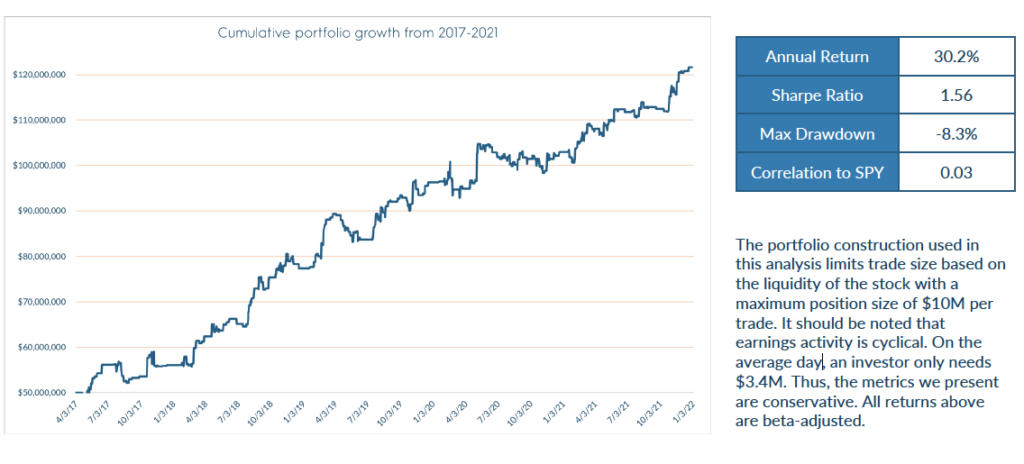
30% Annual Returns: Random Walk Portfolio Utilizing Promotional Intelligence

Robust 5 year returns with no correlations to the major averages

Superior Performance from 2017-2021

Walking Earnings Signals, performance is as follows for entering a trade on the day before the earnings event and exiting on the earnings event date. In practice, the signal would be available shortly after the end of the fiscal quarter and an investor would have a few weeks between the end of the quarter and the earnings announcement date to build this position

Promotional Activity Predicts Share Performance

In this study we’ve illustrated a use case in which a company’s promotional activity data can be used to successfully predict how that company’s stock will move at its next earnings announcement. With strong standalone performance, this study demonstrates that the promotional data can be a valuable input into the decision making process of both discretionary and systematic investors who wish to adjust positions, confirm positions, or discover new trading opportunities heading into earnings events.

Discretionary investors may also wish to use this data to identify inflection points (both positive and negative) in consumer stocks for opportunistic strategies or use this data to identify downside risk for existing positions. Systematic investors may wish to derive ranks with monthly or weekly frequency based on these inputs to drive a long/short decile portfolio.

contact us to inquire about adding the promotional ensemble as a data feed

Download the PDF